
Microsoft’s endpoint management software is some of the most-powerful on the marketplace. We here at Model have dedicated our careers to understanding and leveraging this powerful software to the benefit of the clients who use it in their environments.
That said, with deep knowledge of its strengths also comes deep knowledge of its weaknesses. One Achilles heel of the Microsoft suite, particularly Intune and Configuration Manager, is data analytics.
There is a wealth of information available for improvement of your endpoint management when your Microsoft software is properly configured. However, getting to it and displaying it in a way that makes it useful is honestly one of the suite’s biggest shortcomings.
To be able to improve your endpoints and remediate security holes, you need data about your endpoints and infrastructure that’s centralized, easy to understand, and simple to communicate.
Yes, you can access all this information manually. However, trying to manually access all this data is tedious and time consuming. It takes valuable time away from your team which could otherwise be spent implementing solutions or, better yet, working on tasks that improve user experience and add value to thee business.
That’s really what you and your team want to be spending your time on, not breaking your mouse’s left-click key jumping in and out of Intune blades to get the data that you need.
The Model Power BI Dashboard
To fill this gap, our Unified Endpoint Management as a Service created a single-pane-of-glass solution for aggregating a broad spectrum of data from the different Microsoft endpoint software into one convenient PowerBI dashboard.
This dashboard:
- Centralizes a massive amount of data about your endpoints from multiple software into a single dashboard
- Displays the data in easy-to-understand visuals
Allows you to query, search, filter, and export data for a variety of endpoint management purposes
The dashboard can be configured for both on-premises and cloud-based environments and pulls data from different locations depending on the type of infrastructure that you use.
On-Premises
- Configuration Manager
- Optionally, Model UEMDB (A small but powerful middleware database)
Cloud-Based
- Microsoft Intune
- Azure Active Directory
- Azure Graph
- Log Analytics
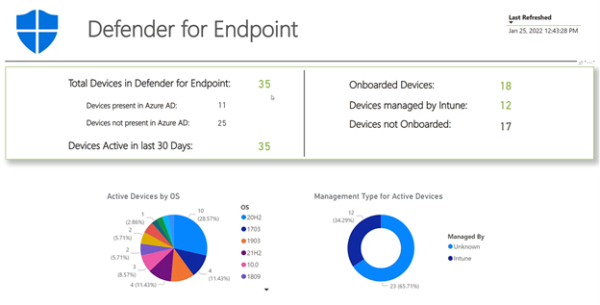
- Defender for Endpoint
Once configured, the dashboard displays data from these sources in neat, clean, and interactive displays so it’s quickly and easily available for a variety of purposes.
In this post, we’re going to talk about three sections of the dashboard and how they can help you to:
- Inventory All The Software In Your Environment
- Manage Your Software Compliance
- Gain Insights Into Your Device Management
To watch a full video demo of the whole dashboard, you can visit this link. Demos are available for both cloud-based and on-premises environments.
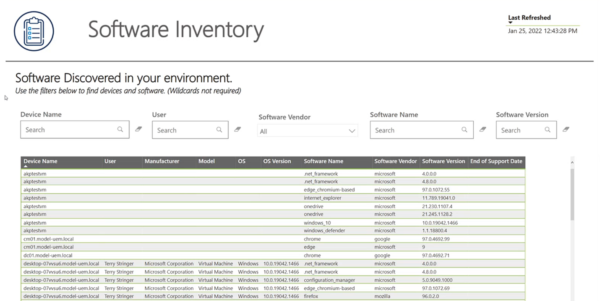
Inventory All the Software In Your Environment
The Software Inventory section of the dashboard centralizes data all the devices as software in your environment. Some of this data includes:
- Software name
- Software Version
- Software Publisher
- End Of Support Date (if available)
- Device Name
- User
This data is searchable, sortable, and filterable so that you can discover which machines and users in your environment have particular software and manage them accordingly. You can also export any dataset to Microsoft Excel.
Having this data in one place has a variety of benefits.
For example, you can use it to quickly remediate known vulnerabilities. Say a particular version of Adobe Photoshop has a known vulnerability that’s been fixed using an update. However, you are not sure which of your machines running Photoshop have this particular update. Using this dashboard, you can do a vendor- or software-specific search and identify exactly which machines do not have it yet.
![]()
Another benefit is re-imaging lost devices. Say a device gets lost or stolen. Which software were installed on the machine when it was lost? Using this dashboard, that information can quickly be identified and the computer rebuilt to the exact specifications as (or better than) it was before.
There are additional benefits of this dataset, including the ability to:
- Easily export a list of all software across your endpoints
- Search for unwanted software and leverage the management tools to remove
- Quickly identify all versions of a particular application in your environment
- In some cases, know exactly when a particular piece of software is no longer going to be supported so that you can upgrade it and stay supported
If you would like to see a demo of this dashboard panel, you can watch that here:
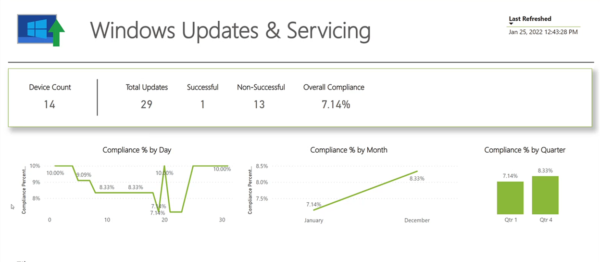
Manage Your Software Compliance
The Windows Updates and Servicing section of the dashboard reports on patching and update status of your endpoints. Data otherwise difficult to access in Intune and Configuration manager are centralized here, including:
- Total deployed updates
- Successful vs. non-successful updates
- Overall compliance
- Compliance % by day, month, and quarter
- Current updates installed in your environment
- Update status by-endpoint
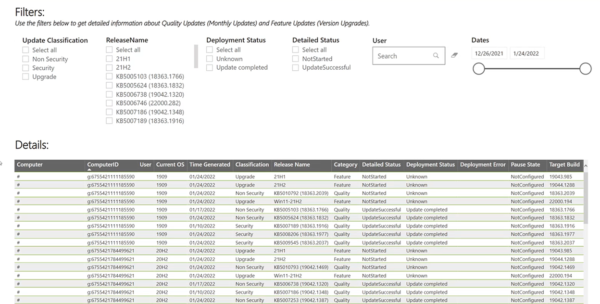
The updates are filterable and sortable by numerous attributes such as:
- Computer & Computer ID
- User
- Current OS
- Release name
- Deployment status
- Update classification
- Date
- And more
This data lets you quickly ask and answer questions about your patching, such as:
- Where am I at with compliance?
- Which devices need patching and which patch or patches do they need?
- Which devices have successfully upgraded to a new Semi-Annual Release?
- What updates are installed on a particular machine?
This information in a cloud-based environment is normally buried multiple-blades deep in Intune. Having it automatically pulled, aggregated, and displayed saves time, effort, and mouse clicks that would be better allocated somewhere else.
If you would like to see a demo of this dashboard panel, you can watch that here:
Gain Insights into Your Device Management
The Device Management section of the dashboard allows you to know the state of your endpoints without digging through frustrating Configuration Manager or Intune reports.
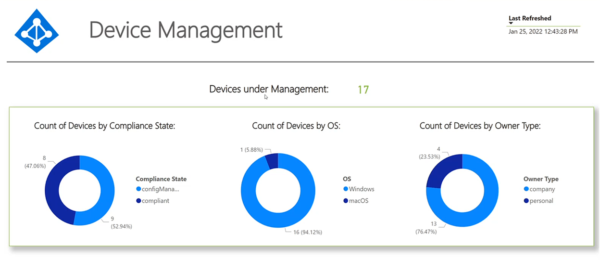
This section pulls data from Azure Graph, Microsoft Intune, and/or Microsoft Configuration Manager such as:
- How many devices are managed in your environment by Intune and/or Configuration Manager
- Compliant vs. non-compliant percentages
- Number of devices by OS
- Number of devices that are personal or company-owned
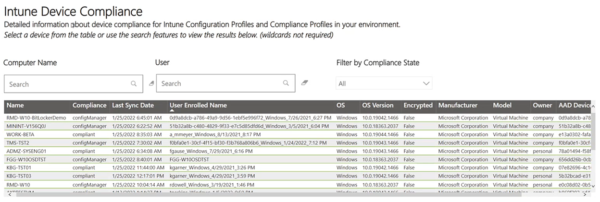
- Intune device compliance
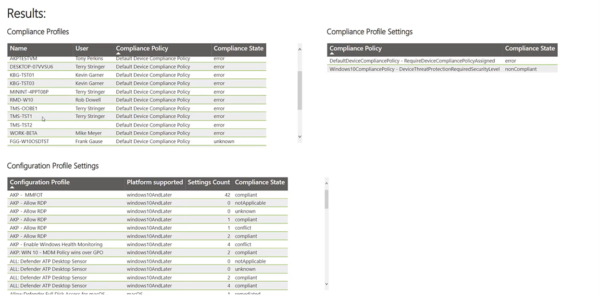
- Configuration profiles deployed in your environment
- Results of compliance profiles specific to a device
As before, this information is filterable, sortable, and searchable by different categories such as computer name and/or user, allowing you to identify problem devices with just a couple clicks.
There are plenty of other benefits of this consolidated data. With this dashboard, exact information can be found about models, manufactures, and the OS of all the devices in your environment.
This can be incredibly helpful for asset purchasing.
For example, knowing how many old computer models to budget for replacing in the upcoming year.
For IT professionals, quickly identify the Compliance Profiles and Configuration Profiles deployed in your environment and the status of each.
If you would like to see a demo of this dashboard panel, you can see that here:
Learn More & Watch the Full Demo
Our team is committed to understanding the Microsoft Endpoint Management suite for our customers, leveraging its strengths, and, when necessary, compensating for its weaknesses. We’d love to show you how this dashboard can help to integrate your current Microsoft software, improve your endpoint management, and reallocate your time to value-added tasks.
You can watch video demos for both on-premises and cloud-based environments here.
Tune in for more posts about leveraging the power of Microsoft’s endpoint management suite. It is incredible software, and we are here to help you tap into the full potential.