
Welcome to another installment of our Maturity Model series. In this post, we’ll briefly cover the Maturity Model phases and categories, and what the Updates and Servicing category looks like at Level 5 maturity.
Our Maturity Model
Our UEM maturity model is used to benchmark infrastructure maturity in any organization. Our model breaks down infrastructure maturity into 5 categories and 5 phases. The phases are:
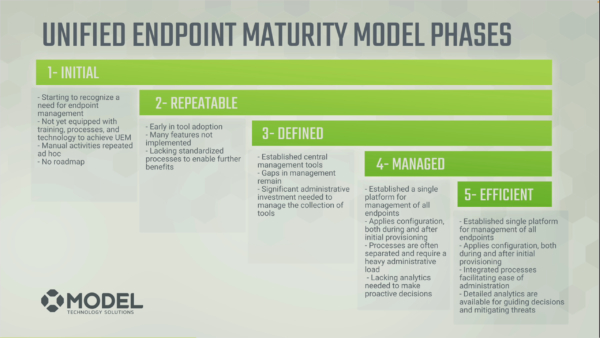
- Initial phase
- Repeatable
- Defined
- Managed
- Efficient
These phases are applied across these categories as they pertain to endpoint management:
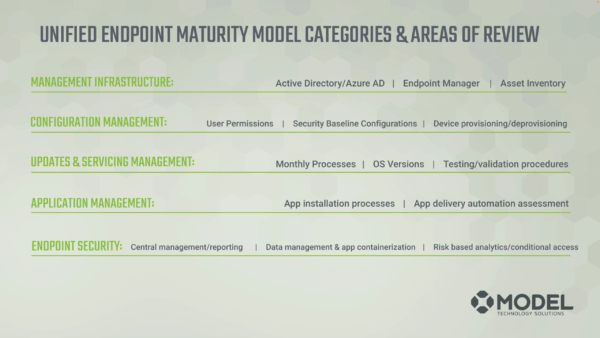
- Management Infrastructure
- Configuration Management
- Updates and Servicing
- Application Management
- Endpoint Security
With this model, we can assess your endpoint maturity using categories on a scale and then see where it would most benefit you to invest time, energy, and/or money to improve security, efficiency, and reduce your infrastructure costs.
For example, in these images, we’ve rated Updates and Servicing as Level 3 and Endpoint Security as Level 5.
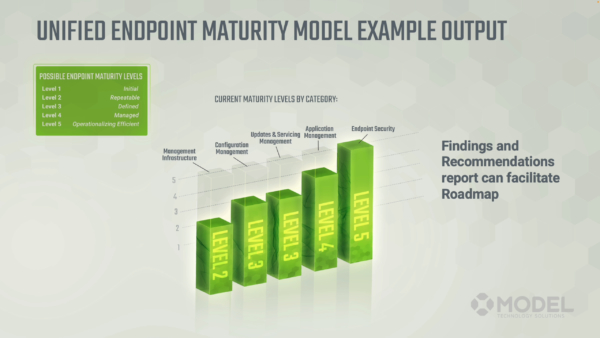
Let’s say that your entire holistic endpoint security needs to be a Level 5. Our maturity model can help assess where you’re at, and then our “roadmap” document will give you tangible next steps to improve your infrastructure to get it where it needs to be.
Updates and Servicing Level 5
Today’s post will focus on the Updates and Servicing Management category, which includes:
- Monthly Processes
- Operating System Versions Testing
- Testing/ Validation Procedures
So, what does Updates and Servicing Management even look like at a Level 5? Some defining characteristics include:
- Well Defined Processes for Updates
- Automation of those processes
- Both in a basic and an advanced stage.
- Major operating system releases
- Feature upgrades can get rapidly deployed with a minimal amount of user disruption as an example.
- Analytics
- Analytics give you the ability to make strategic decisions based on what’s going on in your environment. Having a dashboard able to provide near real-time status of patch compliance and percentage gives you an advantage for a multitude of angles.
Processes for Updates
Every organization has different processes based on their environment. There’s a certain amount of testing and validation that will occur which can be used as guidelines, but ultimately your processes should be aligned to your business or organization.
Generally speaking, processes include:
- Test
- Deploy in an optional state
- Deploy in a mandatory state
- Remediate (until you get to your target compliance percentage.)
Your target percentage over the years should be climbing up because of devices standardization and, in many cases, it should be easy to identify the common problems with patching in your environment because of this standardization as well.
Business Alignment
One of the most-important indicators of a Level 5 Updates and Servicing is business-alignment. There is a fine line between being secure and enabling people to do their job. You can certainly hinder people’s progress if your security practices are so stringent that they can’t move throughout their day fluidly without disruption. However, too much leniency and you open yourself to significant risk.
So, learning what users need to work and understanding that you might need to align with business units to identify a proper deployment schedule is very important.
Ultimately, you want your processes to be “business-aligned” when you’re at Level 5. When your update processes are business-aligned, it means that you’re being mindful of the experiences of the end consumers of the devices.
For example, you deploy their patches according to a schedule that doesn’t interrupt their work flow but is still sufficient for your security needs. If you know that certain departments within your organization will batch their processes during the end of the month, then you also know that wouldn’t be a good time to set the deadline for the applications to update.
Your processes can also be expedited for Zero-Day patches. Nothing should come as a surprise when a Zero-Day patch needs to go out, because you’re just following your normal processes in a faster manner with a different timeframe, keeping interruptions to a minimum.
You also need to understand and work with the culture of your organization and fit your updates into how your organization works.
Ultimately, understanding that the deployment schedule is just a piece of the puzzle and aligning it with the business – as opposed to dictating what should happen from IT – can lead to a lot of benefits when it comes to patch compliance, and this is an essential element for highly mature Updates and Servicing.
Automation of Updates
Automation covers everything from very basic automation to the most advanced troubleshooting when it comes to the patch process.
For example, in Level 5, basic automation would involve:
- Automation on a monthly cadence.
- Patches are released or provisioned regardless of your tool set in an automated fashion to your test group.
- Your test group is notified that patches are there. Depending on how your process is defined, a response or non-response might be required.
- A non-response by a certain date might serve as an approval to move forward with patch deployment.
This will likely look slightly different for every organization. If you have dedicated people that understand that there might be something different about their PC, you can take some of that basic automation and really expedite some of those processes.
Advanced automation is one of our specialties at Model Technology Solutions and is sometimes required for Level 5 Updates and Servicing.
For example, we have tens of thousands of endpoints under our managed services team. From the data that we’ve gathered, we’ve taken all of our knowledge of software updates to create a troubleshooting script. If an update does not deploy correctly, it runs through a series of the most common reasons why updates fail and attempts to automatically remediate them.
This is an example of one way you can use custom automation to improve patch compliance that much more.
Analytics
Analytics is critically important for understanding the ebbs and flows of patch management. If you’re going to improve, you need data to aggregate, interpret, and implement.
This is a screenshot from our Custom PowerBI dashboard, a tool we offer that aggregates and displays massive amounts of analytics from across the Microsoft Suite software. In the example on the left, patch compliance drops on patch Tuesday. Makes sense. The patch cycles then go through their normal patch window, after which they return to a hundred percent. When the next patch Tuesday rolls around, the machines identify the fact that they need additional patches. After patching, they go back to 100% compliance.
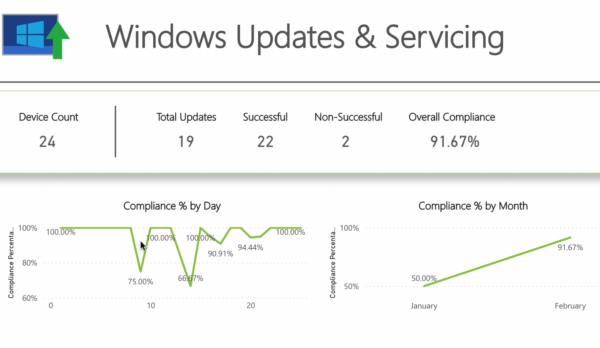
Using this aggregated data, you can see that there are ebbs and flows on a daily basis for patch management. This is acceptable. In fact, it’s a sign of a healthy infrastructure when the rhythms are consistent like this. Having this data in one place helps you to identify and use these rhythms to benchmark and improve your processes and systems for compliance and security.
On the right side of the screenshot is another example. You have percentage compliance by month, and you want to trend your percentage compliance month over month as well to see how you’re doing on a broader scale.
In an ideal world you’re able to access a single dashboard – like our PowerBI Dashboard – and identify how many devices you have as well as their total percentage of overall compliance.
In the screenshot above, there are 24 devices with 91% compliance in our test lab. This is a great example of the kind of data you need to be able to go find at any point in time in Level 5 Updates and Servicing.
You should also be able to drill down into particulars to identify specific patch compliance related to different attributes such as particular endpoints or endpoint type. Our PowerBI Dashboard is a perfect example of the type of tool that you can use to actualize this, though it’s not the only tool out there.
Here’s another example of this kind of aggregated data from our dashboard. It shows a month-to-month view of compliance and has many filtering capabilities.
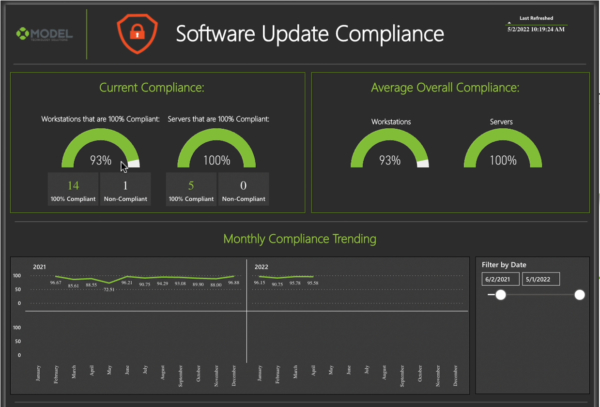
You can see the data broken down by workstations and servers. This ability to filter by device type is essential so that you can see, for example, that five servers in our test lab are 100 percent compliant. We have one device that is not compliant and 14 that are, giving us an overall percentage of 93% for our workstations. This is the data flexibility and transparency that you need to be able to have a Level 5 maturity in Updates and Servicing.
Ultimately, a Level 5 maturity in Updates and Servicing means that you have reliability, empathy, and flexibility in your updates, servicing processes, and tools, resulting in the ability to understand and improve your compliance as well as other success metrics. This includes:
- Processes which are efficient, consistent, and business-aligned with your organization, end users, and culture at large.
- Well-implemented tools that help you to aggregate, understand, and actualize data-driven initiatives to maintain and improve your success metrics such as compliance, security, and cost-effectiveness.
When these elements are in place, you’re about as mature as you can be regarding your Updates and Servicing. Congratulations!
Our Maturity Model Assessment
How do you get there? Well, first you need to start with a benchmark of where you’re at and a roadmap of how to get there, and we’d love to help with that. Our IT Maturity Health Check service is a perfect way to assess the maturity of your infrastructure across the board. With this data, you can then identify the best categories to improve and projects to implement in order to improve your maturity and reap the benefits that result from it in security, compliance, and cost-effectiveness.
Practically what this service looks like is:
- A short questionnaire
- A 90-minute onboarding
- A 90-minute review session
Our first 90-minute session will help us get a deeper understanding of your environment. We’ll review everything from business operations, alignment, challenges, roadblocks, user adoption of new technology, and talk about specifics of where you’re at from a technical and a tactical standpoint in each of the categories.
Using your questionnaire and the information from this session, we’ll create a findings and a prioritized recommendations list that we’ll deliver in the next 90-minute session. You will also have the opportunity to ask any questions about how we operate or about the report. The information delivered during the second session will help you identify projects you could use to improve your maturity.
If you’d like to learn more about the Health Check, you can learn more about it here. Many of our current clients have gone through the Health Check and have found it to be a tremendous value.
Questions? Feel free to reach out! You can use our contact page, or you can email me at Jason.ruthford@model-technology.com. Always happy to chat!