Welcome to the third post of our Intune Reporting Series. The first post introduced Intune’s reporting framework and core concepts, then dove in to identify and discuss the various Operational reports strewn throughout the system. The second post identified and discussed the many Organizational and Historical reports in Intune, along with where they excel and where their usage is limited.
This third post will begin to discuss the options available for advanced Intune reporting beyond that which is provided from the out-of-the-box reports. It will also identify the capabilities provided by Intune for accessing its underlying data and tools with which you can use that data to build your own reports, specific to your needs.
As before, the goal is to empower you to better leverage Intune’s data to understand your endpoint fleet and help improve security and management of your company’s endpoints. Read on for more information!
Advanced Intune Reporting
Under its hood, Intune collects a wealth of endpoint data, much of it not exposed through the out-of-the-box reports. Intune does however provide mechanisms for administrators to access that data and use it for many purposes, including automation of Intune management and custom reporting. Advanced Intune reporting involves querying that data directly from Intune and transforming the data to your particular needs, presenting it in whatever form you want. Here, you will be getting outside of Intune proper and into tools that you can use to query and work with Intune’s data.
The three primary mechanisms Intune provides for advanced reporting are through integration with:
- Azure Monitor / Log Analytics
- Intune’s Data Warehouse
- Microsoft Graph API
Each of the following sections will provide specific details on each mechanism, how to set it up, and how to use it to build custom reports.
Azure Monitor / Log Analytics Integration
Overview
Azure Monitor and its underlying Log Analytics service provide a common monitoring & reporting framework used across all of Azure. Azure resources can be configured to route data to Azure Monitor via “diagnostic settings”, granting administrators some control over which types of data are sent to Azure Monitor. Similarly, Intune can be configured to send platform logs and metrics to Azure Monitor through the creation of diagnostic settings.
Once in Azure Monitor, this data can be queried and processed using Log Analytics’ query language, “Kusto”, or “KQL”. This data can also be presented through KQL visualization output and through Azure Monitor Workbooks. Workbooks provide a means of packaging and presenting pre-written queries in an ordered fashion to provide a dynamic report-type experience. Intune has several Azure Monitor workbooks pre-configured to show data if the appropriate diagnostic settings are configured.
Configuration
Before Intune can be configured to send data to Azure Monitor, an Azure Monitor / Log Analytics workspace must be created and available to receivea the data from Intune. You can follow the instructions in Microsoft’s documentation here to create a workspace via the Azure Portal. If you are creating a workspace specifically for your Intune logs, you may wish to review the cost considerations for the Log Analytics workspace and Intune logging configuration. Once a workspace has been created, the diagnostic setting to send data from Intune to Azure Monitor can be configured in the Intune portal.
In Intune’s Reports node, below the Operational & Historical reporting categories, can be found another category titled “Azure Monitor”. The first option beneath the category, “Diagnostic Settings”, is where Intune can be configured to send data to Azure Monitor.
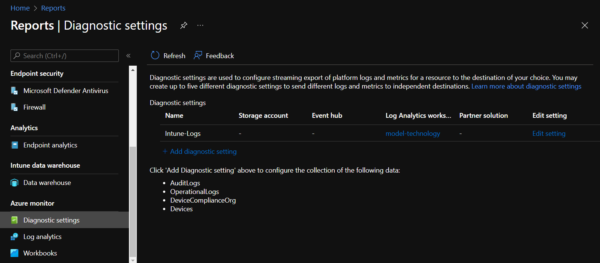
Either click the “Add diagnostic setting” text to create a new diagnostic setting or click “Edit setting” to modify an existing setting, should one exist (as seen in the screenshot above). Within any diagnostic setting, there are four different types of Intune logs that can be configured to be sent to Azure Monitor, defined as follows:
- “AuditLogs” – Contains records of Intune change events and can be used to determine who configured what in Intune, when. Types of change events include the creation, update / edit, deletion, and assignment of policies, along with the invocation of remote actions on managed devices.
- “OperationalLogs” – Contains details on users and devices that successfully or unsuccessfully attempted to enroll in Intune, as well as details for non-compliant devices.
- “DeviceComplianceOrg” – Provides operational reporting data for device compliance within Intune, along with details on non-compliant devices.
- “Devices” – Provides records on each managed device reporting to Intune, including the primary owner / user information where applicable
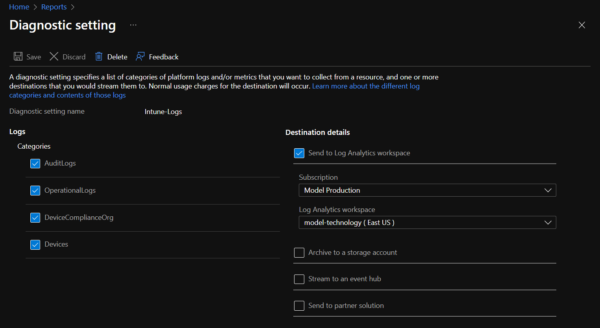
To create the diagnostic setting, simply select the types of logs to be sent to Azure Monitor and select the “Send to Log Analytics workspace” option under “Destination details”. The workspace and its subscription will need to be selected, after which the diagnostic setting can be saved and data will begin flowing to Azure Monitor.
Diagnostic settings can also be used to send data to an Azure storage account, to an Azure Event Hub, or to a third-party log analytics solution, if desired.
Usage
The easiest way to use the log data sent to Azure Monitor / Log Analytics is via the “Workbooks” and “Log Analytics” views under Intune’s Reports node, in the “Azure Monitor” section. These expose relevant components of Azure Monitor and Log Analytics through the Intune portal itself, making it easier for Intune admins to focus on Intune data rather than be bogged down by other monitoring data.
The recommended first place to go is the “Workbooks” view. This view exposes the four workbooks that ship with Intune and leverage the log analytics data :
- Intune Audit Activity
- Intune Enrollment Activity
- Intune Compliance Activity
- Intune Device Activity
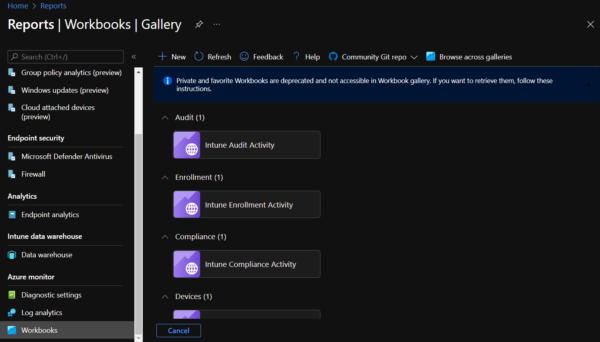
Any of the workbooks can be clicked on to open them up, which will automatically refresh the underlying queries and show graphs and relevant data from the logs. Do note that, if there is no data returned by a query (such as because the diagnostic setting was just configured, or because there haven’t been any enrollments in the past 7 days, etc.), then the workbook will show no data for a query.
The “Workbooks” view also provides the capability to build your own workbooks, though doing so requires adding custom Kusto / KQL queries to retrieve and process the Intune log data in whatever way is relevant for your needs. This is where things get very advanced, as knowledge of Kusto is required to write the queries. We won’t go into detail on how to write queries in this post, but you can refer to sources such as Microsoft’s KQL Tutorial for an introduction on using the language. You also may be able to find examples of Intune KQL queries on the Internet – do note that queries are non-destructive and do not affect the underlying data, so using random queries found on the Internet is generally safe. At the very least, though, you can use them as a reference to learn KQL and write your own queries.
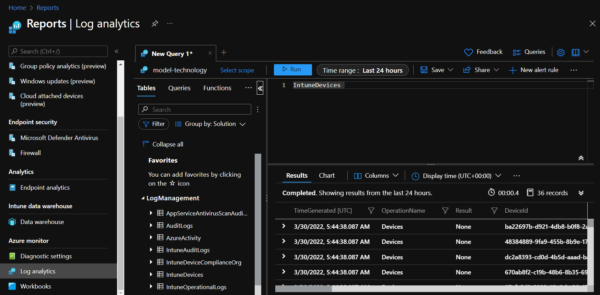
In order to write and test queries, either for a workbook or for on-the-fly usage, navigate to the “Log Analytics” view in Intune’s Reports node. Here, you’ll get the full Log Analytics query interface, providing access to any data stored within a workspace. Intune’s logs will be found under the “Log Management” category and can be recognized easily as they all start with “Intune”. Queries can be written in the editor, ran to review the results, and saved for later usage.
Overall, the Azure Monitor / Log Analytics integration provides some powerful capabilities through the Kusto query language to analyze Intune log data, however the type of data in the logs is limited to specific use cases and won’t always be a useful solution depending upon what reporting data you are trying to represent. It is very useful for what it does, but for more advanced operational reporting, we recommend leveraging the Graph and Data Warehouse APIs, detailed below.
Intune Data Warehouse
Overview
Intune has a Data Warehouse service designed to provide historical data for custom reporting. This data is refreshed on a daily basis from the main Intune data and is intended for historical and trending reporting, not for real-time reporting. The Data Warehouse is exposed via an OData endpoint; Microsoft provides specific instructions on connecting to the Data Warehouse via Power BI, but any system capable of querying data through the OData standard can connect and retrieve data.
Once connected, reporting tools like Power BI or Microsoft Excel can visualize the data model and provide all the tools needed to build reports and present the data in whatever way is important to your business needs.
Configuration
Before discussing how to connect to the Data Warehouse, we first need to establish the prerequisites for accessing the data. In order to access the Intune Data Warehouse, one of the following conditions must be met:
- User accessing the report must be one of the following:
- Azure AD Global Administrator
- Intune Service Administrator
- Granted access to Intune Data Warehouse through Intune’s role-based access control
- User-less authentication must be configured via an Azure AD App Registration
- For instructions on configuring user-less authentication, refer to Microsoft’s documentation here.
Once the requisite access permissions are in place, we can configure the connection to the Data Warehouse. To do so, first go to the Reports node in the Intune portal. Another subcategory, alongside the Operational & Historical reporting subcategories and the Azure Monitor subcategory, is named “Intune data warehouse”. It contains a single view, titled “Data warehouse”, which contains the information needed to connect to the Data Warehouse, along with links to the documentation on using the data warehouse.
The “Data warehouse” view provides two ways of connecting to the Data Warehouse:
- A link to a pre-made Power BI app for the Intune Data Warehouse, under a link titled “Get Power BI app” in the “Microsoft Power BI Online” section
- The OData feed URL used by reporting tools to connect to the data.
The Power BI app is a pre-configured Power BI Online report that has some very basic reports in it, along with a pre-defined connection to the Data Warehouse, that can serve as an example for report creation or as a starting point for further customizations and development. The downside of this app is that it only functions in Power BI Online, meaning you lack the full capabilities provided by Power BI Desktop for report creation and management. It is a good place to start, though, if you’ve never worked with Power BI.
The OData feed URL can be used in any reporting tool that supports it, including Power BI and Microsoft Excel. This post will be working with Power BI and illustrating how to connect to the Data Warehouse from there.
To connect to the Data Warehouse from Power BI, first install or open up Power BI Desktop on your computer and pull up a new report. Once that is done, do the following:
- In the Intune portal, in the “Data warehouse” view, copy the OData feed URL.
- Open Power BI Desktop, then click File > Get Data, then select OData feed.
- In the prompt that appears, ensure Basic is selected, then paste the OData feed URL copied from Intune into the URL field and select OK.
- In the next window, select Organizational Account and click the Sign in button, then provide your Azure AD credentials with access to the Data Warehouse.
- These instructions assume we are using user-based authentication, not user-less.
- Click Connect and Power BI will connect to the Data Warehouse using the provided credentials.
- In the “Navigator” window that appears, select one or more of the tables to import into Power BI, then click Load to load the data.
Be warned – Power BI will load all of the selected tables into the report and into memory – this can use a significant quantity of resources depending upon your environment. For initial testing and report-building, you may want to add more than the data you explicitly need in order to understand what data is available. However, for production reports, it is recommended that you only load the tables that are needed for your reports to keep the report size down and performance optimized.
Barring any errors, the Intune Data Warehouse will now be loaded into Power BI and ready for you to use to create reports!
Usage
Once imported into Power BI (or whichever reporting tool you are using), standard reporting techniques for your reporting tool can be used to explore and present the data. Given that the data is imported from a collection of tables, the first thing you may need to do is to create the relationships between the tables so that your reporting can take advantage of the richness and depth of the data and deliver the insights you need. Power BI will attempt to do this automatically when it imports data from the Data Warehouse, but you may want to review the data model and relationships and validate they are correct, adding any that are missing.
In the following screenshot, you can see part of the data model automatically generated by Power BI Desktop on import from the Intune Data Warehouse:
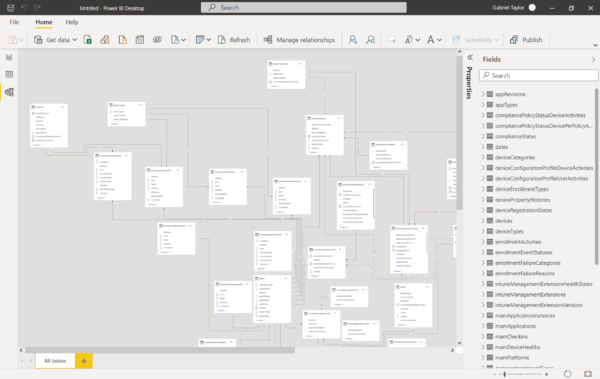
The right-hand pane, labeled “Fields”, lists each of the tables imported from the Data Warehouse. Expanding any given table will list the individual properties on those tables, containing the actual data to be used in your reports. Data types for those properties should be correct based on the source data type in the Intune Data Warehouse, but you can use your reporting tool to adjust data types if needed, along with adding filters and creating custom properties that build on the Intune Data Warehouse data as needed for your specific reporting needs.
A full tutorial of Power BI Desktop is out of scope of this blog post, but refer to Microsoft’s Power BI Getting Started documentation for a breakdown of how Power BI works and how to go about working with the Intune Data Warehouse data to build the custom reports you need.
The Intune Data Warehouse provides a powerful vehicle for connecting to Intune’s data and building most any custom reports you need. As stated above, its intent is to provide data for historical and trending analysis rather than real-time reporting, and at that it excels. If you do need access to Intune’s real-time data, though, then the remaining option for advanced Intune reporting, via the Microsoft Graph API, is where you need to go.
Conclusion
So far, two of the three main mechanisms for advanced Intune reporting have been covered– Intune’s integration with Azure Monitor / Log Analytics and the Intune Data Warehouse. The final post in this series will cover the third mechanism, leveraging the Microsoft Graph API for access to real-time Intune data, along with providing an example of what a completed advanced Intune report in Power BI can look like.
Hopefully this series has continued to be useful in introducing you to the various capabilities for reporting in Intune and preparing you for building your own custom reports to power and inform your endpoint management processes.
To be concluded!
