
If you’ve been using Microsoft’s endpoint management suite for any length of time, you’re likely familiar with how tedious accessing reporting data can be.
Often you as an IT professional are likely stuck digging through multiple software and reports to find and export the data that you need, or you’re caught in the endless click cycle of going endpoint-by-endpoint to gather compliance, device, or software data for reporting purposes.
Likely you’ve continued to do things this way because, simply put, there’s no better way. Reporting is an Achilles heel of the Microsoft endpoint management suite, and Microsoft has shown no signs of creating any more of an all-encompassing or intuitive solution anytime here soon to fill this need.
Nobody loves this compromise, including our team here at Model Technology Solutions. Which is why we’ve created a single-pane of glass dashboard to help our customers with Microsoft-based environments (and you) save time, improve reporting, and simplify this process of accessing, aggregating, and interpreting the data that they need for endpoint management.
The Model PowerBI Dashboard
Do you use the Microsoft endpoint management suite in your environment? What if there was a better way to access reporting data? What would it look like if you could view, manipulate, and export data from all your disparate Microsoft software from a single location?
That’s the solution we’ve tried to create using the new Model PowerBI Dashboard. Practically, the dashboard consists of multiple different tabs that aggregate and display data from different Microsoft software in clean and straightforward graphs, tables, and interactive sorting tools.
Instead of opening individual management software, all your data can now be accessed, sorted, filtered, and exported from a single location that’s far more intuitive than anything provided by the Microsoft software themselves.
No longer will your IT techs spend hours clicking in and out of reports in Configuration Manager. Instead, they’ll spend more time tackling other tasks and initiatives they’d quite honestly rather spend time on anyways.
The dashboard can be implemented however your environment is managed:
- On-premises
- Cloud-based
- Using a hybrid solution
Several weeks back we released the first of our posts featuring the dashboard. In that post, we showcased three benefits of the dashboard and provided demos if you have a cloud-based infrastructure. This week we’re going to talk about the same three features as in the last post; however, we’re going to feature them particularly featuring the on-premises version of the dashboard instead.
At Model Technology Solutions, we’re committed to supporting you and your IT team no matter however you manage your environment. Whether you manage your endpoints on-premises, through the cloud, or using both, this dashboard allows for you to have a cleaner, more-efficient, and quite simply put better all-around experience for data access and reporting.
Let’s jump into the benefits. The three we’re going to cover in this post today are how you can:
- Manage Your Devices
- Inventory All Your Software
- Monitor Your Compliance Status
…using the on-premises dashboard solution.
If you’d like to skip ahead and just see the dashboard in action, you can learn more and see the demo of both versions here.
Manage All of Your Devices
Managing devices in an on-premises or hybrid infrastructure has never been easier. With the Model dashboard, all your device data is pulled from Configuration Manager, aggregated, displayed, and available for manipulation and export for a variety of purposes.
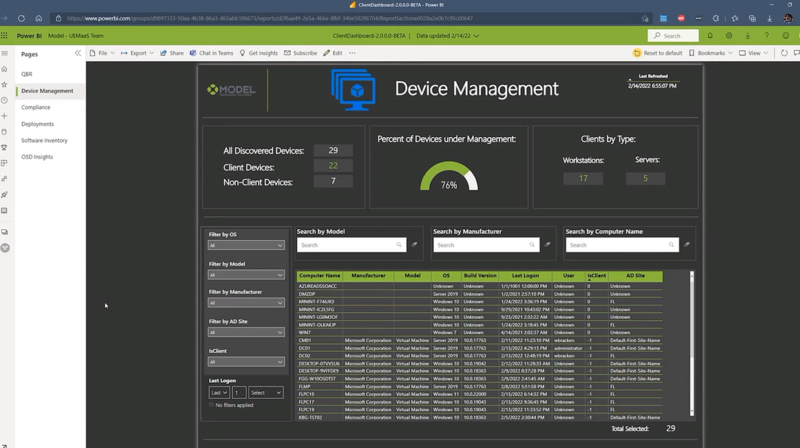
There’s even more device management data here than on the cloud-based solution tab; Configuration Manager puts out more data related to this subject than Intune, and all of it is aggregated on this tab.
Some of the data that it pulls includes:
- How many devices are managed in your environment by Configuration Manager
- Percent Of Devices Under Management
- Workstations vs. Servers
- Basic data about the hardware in your environment including:
- Computer Name
- Manufacture
- Model
- OS
- Build Version
- Login Information
- User
- AD Site
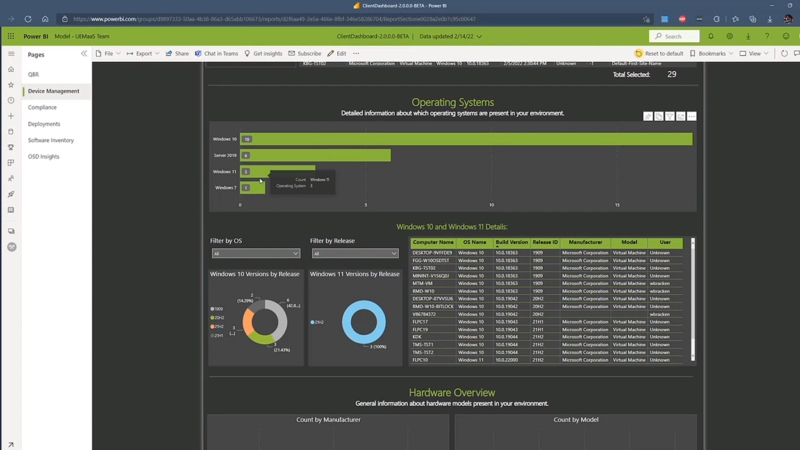
- Number of devices by OS
- Windows Build Details
All this data can be sorted, filtered, and exported to an Excel spreadsheet to be sent or analyzed with ease.
Having all this data gives you an honest look at your environment’s health. Rather than vague and intermittent data accessed once a month, all your data is available to you accurately 24/7/365 so you always have an accurate portrait of your devices.
Among other uses, this data is essential for your asset management and procurement teams. The ability to search by manufacturer, machine type, and current OS allows for you to export data about which devices need to be and can be upgraded. You can also quickly identify which machines will be unavailable for an OS update and thus must be replaced. All this functionality ultimately simplifies your process for getting purchasing reports to these departments.
You can also quickly identify unapproved devices in your environment. If your policies allow for Dells, and you see Lenovos on the list, you know that someone is purchasing and onboarding unapproved devices. You also can see exactly what users these devices belong to, allowing them to be quickly located and removed if necessary.
If you’d like to see a demo of this tab, you can watch below. Or you can see a demo of the entire dashboard in action here.
Monitor Your Compliance
Tired of running tedious compliance reports once a week? Your compliance reporting is easy and efficient using the Model PowerBI dashboard to a degree not possible if you’re using Configuration Manager on its own.
The powerful features of this tab are your ability to:
- See real-time compliance reports
- Quantify exactly how many devices are and are not compliant
- Drill down into each device and identify exactly which patches need to be applied
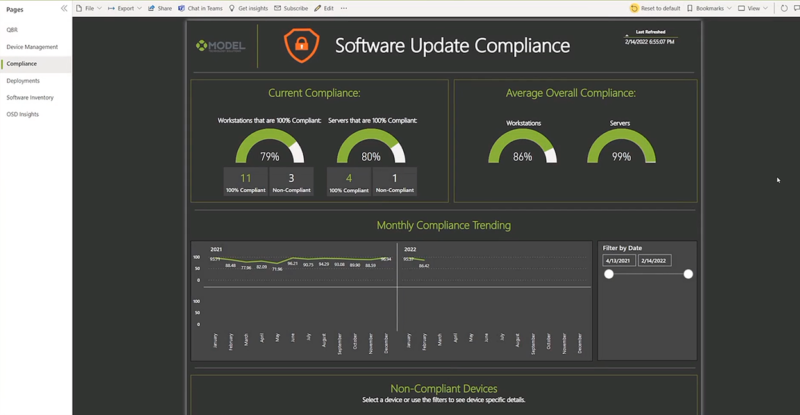
Specific data that this tab includes:
- Current Compliance Percentages
- Average Overall Compliance
- Monthly Compliance Trending
- Non-Compliant Device Information
- Required and Installed Updates
You can also filter non-compliant devices by:
- Device Name
- Update Name
- Device Type
- Severity of Patch
This ability to see exact devices and filter compliance data by a variety of factors makes follow up on patching deployment much more effective and efficient.
Instead of exporting individual device reports from Configuration Manager, the PowerBI dashboard automatically translates error reports so that you know exactly which patches failed to deploy on which devices. Using that data, you can track down these devices, manually deploy the patch, and ensure that your environment is secure.
This tab also lists out any unknown devices in Configuration Manger that are not participating at all in the update process. That way you know that either it’s a stale device or something’s wrong with the device that needs to be fixed.
While the compliance tab has similar echoes in the cloud version of the dashboard, the Software Inventory tab has quite a few differences.
You can select a device to see all installed updates, and all updates still showing as required. In addition, you can see updates that devices are reporting as needed that are not deployed, giving you the ability to quickly identify and remediate.
This tab saves you time and countless clicks. The hours and labor costs that are saved by not having to manually access and interpret Configuration Manager reports is significant, decreasing the percentage of your team’s time you must allocate to compliance-related tasks.
Essentially, you can accomplish far more in the same amount of time and have a better experience while you’re doing it. Which really could be said about your entire experience with the dashboard, including all the tabs.
If you’d like to see this tab in action, you can watch the demo below. Or you can see the entire dashboard demo and learn more here instead.
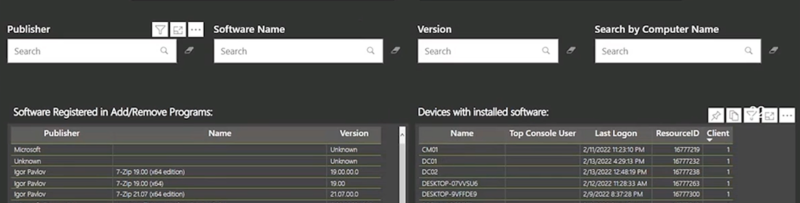
Inventory Your Software
Last but certainly not least is your ability to inventory all the software in your environment. In the on-premises version of this dashboard, data about all the software on all the registered devices in your environment is aggregated from Configuration Manager and displayed in a simple but filterable spreadsheet.
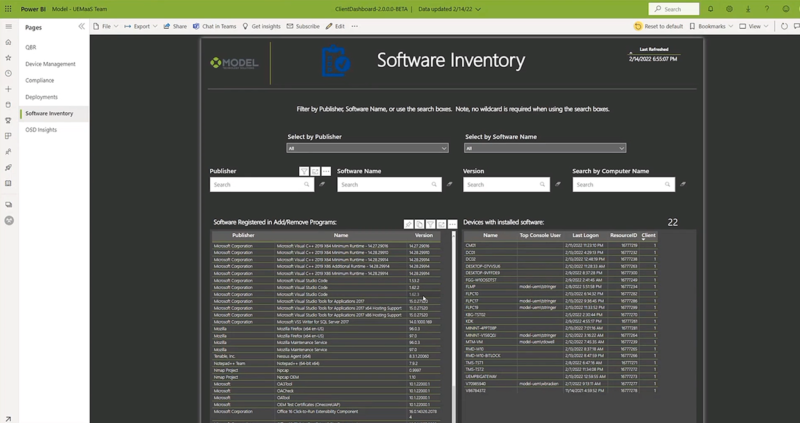
This spreadsheet includes data like:
- Software name
- Version
- Publisher
- Support Date
- End Of Support Date
- Vendor
- Device Name
- User
As always, you can filter this data by software, version, vendor, device, etc., making running and exporting reports about software as simple as just a couple clicks.
But what would this data be useful for? One use case would be upgrading operating systems. If you’re needing to upgrade from Windows 7 to Windows 10, you can quickly identify exactly how many devices are running the outdated OS and report how many new licenses need to be purchased for the next billing cycle.
Another use is identifying and removing unwanted software in your environment. Say that many of your devices are currently using Open Office in lieu of Microsoft Word. Your policies require the latter to be used instead. In this tab you can immediately identify which devices have Open Office installed so that your techs can replace it with the software from the preferred vendor.
Bottom line, the ability to search by software version makes identifying, updating, and securing apps a much less time- and labor-heavy task.
If you’d like to see this tab in action, you can watch the demo below. Or you can see the entire dashboard demo and learn more here instead.
Watch The Demo and Learn More
The reporting capabilities of the Microsoft Software are, at best, mediocre. And yet reporting is essential for vulnerability remediation, assisting other departments, and many other tasks for your IT team.
As we said earlier, our PowerBI dashboard saves you time and countless clicks, not to mention more than a few headaches. Plus, the ability to centralize and run intuitive reports makes the incredible Microsoft software that you use even more powerful.
By using the Model Dashboard, your team will spend less time and labor on reporting and more on strategic tasks and initiatives that add value and improve end-user experience.
If you’d like to learn more about the dashboard or see a demo, you can do so by clicking this link. If you have questions, we’ve also answered some of the most-common questions the same page.
You can also reach out with questions to our team using our contact us page. We’d love to show you the dashboard in action, either through a pre-recorded video or live on a call with our team.